
Datacubed LINKT admin portal
Company: Datacubed Health, 2016-2018
Role: Director of UX, Chief Technology Officer
Team: UX Designer, Visual Designer
Problem
I joined Datacubed as the first UX designer before the company had a product available. As the mobile app continued to develop, the administrator tools which powered the configuration of the SaaS platform, experience of the app, and data output continued to develop.
At the start, we leveraged several off the shelf tools, but those quickly outgrew the goals of the product so it was clear that we needed a portal to help power the system.
As the lead designer, product owner and eventually CTO I owned the end to end architecture of the system. Working closely with our Sr. UX designer, we regularly added new features, capabilities and design improvements on a 2 week rolling basis.
Challenges
How would we make sure that decisions we made for one study wouldn’t adversely impact future design decisions?
How could we quickly implement features to learn and test what new capabilities were relevant?
How do we test the product in an environment with limited and niche user groups?

Solution
The Admin Portal is a flexible way for researchers to quickly deploy custom app experiences with minimal training time using the powerful Cloud-based configuration tools. The system allows for rapid creation, deployment and management of their research studies as well as tools for data analysis, compliance metrics, and export of data to external tools. The system was built from scratch on a tech stack of AWS, Python and React. The key user challenges were identifying needs across a wide range of study types, and boiling that functionality into a simple, modular tool.

Participant Management
A key pain point of research tools is understanding how many participant are active, when to intervene, and when they are lost. By combining features that include real time compliance rates, messaging capabilities, and notifications, the design was able to provide administrators with at a glance understanding and actions.

Custom Survey Builder
Researchers can write and deploy their own surveys in minutes using the drag and drop survey creator. This UX includes behaviors for creating conditional skip logic, as well as a variety of survey components ranging from text, image and audio questions.

scheduling system
Building out the product requirements for where and when participants should see their surveys was part of the challenge. Most studies run from a relative start and end point, so no two participants are ever performing the same activities on the same day. By building out a series of flows and conditions that allow for relative scheduling of activities, we were able to design studies that could handle this complexity and edge cases.
Case Study
PRoblem - How can our platform smooth workflows in a complex user ecosystem?

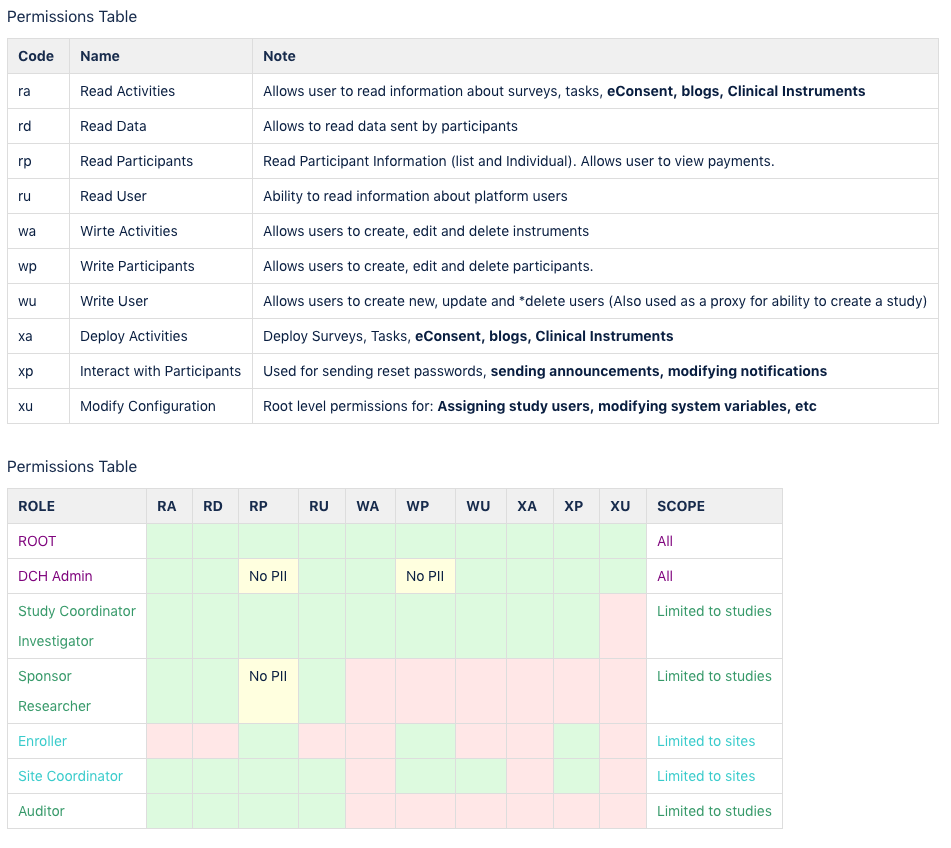
A major hurdle in designing the system was understanding the multi-faceted roles that exist within different organizations, and creating a secure, scalable permissions framework, for properly segregating data. The first step was to clearly break down many of the key stakeholders throughout the lifecycle of a clinical trial, and which data is needed to do their jobs
Once the overall workflows were agreed upon, object properties needed to be defined to allow engineering teams to properly structure the multiple databases which would drive the system (Protected Health Information, Anonymous Participant Data, and System data objects needed to be stored in separate logical databases for regulatory and security purposes). This object and content framework then allowed the UX team begin to define each respective workflow.
Below - Overflow.io diagram to think through and get technical alignment on data flows and object properties

Research methods/tools used
Respondent.io - Used for video interviews with clinicians to walk through task analysis. Total task time, failures and participant ratings measured as KPI’s.
Invision - Used for initial wireframe testing and prototypes.
Direct client interviews - I led direct scoping sessions with clients discussing their current pain points, gaps in their existing workflows, and the jumps between systems that we could help address.
I created documentation for the full system process was using JIRA for user stories, Confluence for detailed requirements documentation, and Zeplin for UI Screens.
As CTO, I supported the end to end product->design->tech SDLC process.
This screen layout shows one of the final configuration workflows which allows study coordinators to setup and configure studies, including a dynamic timeline element for configuring the many variables associated with a project.

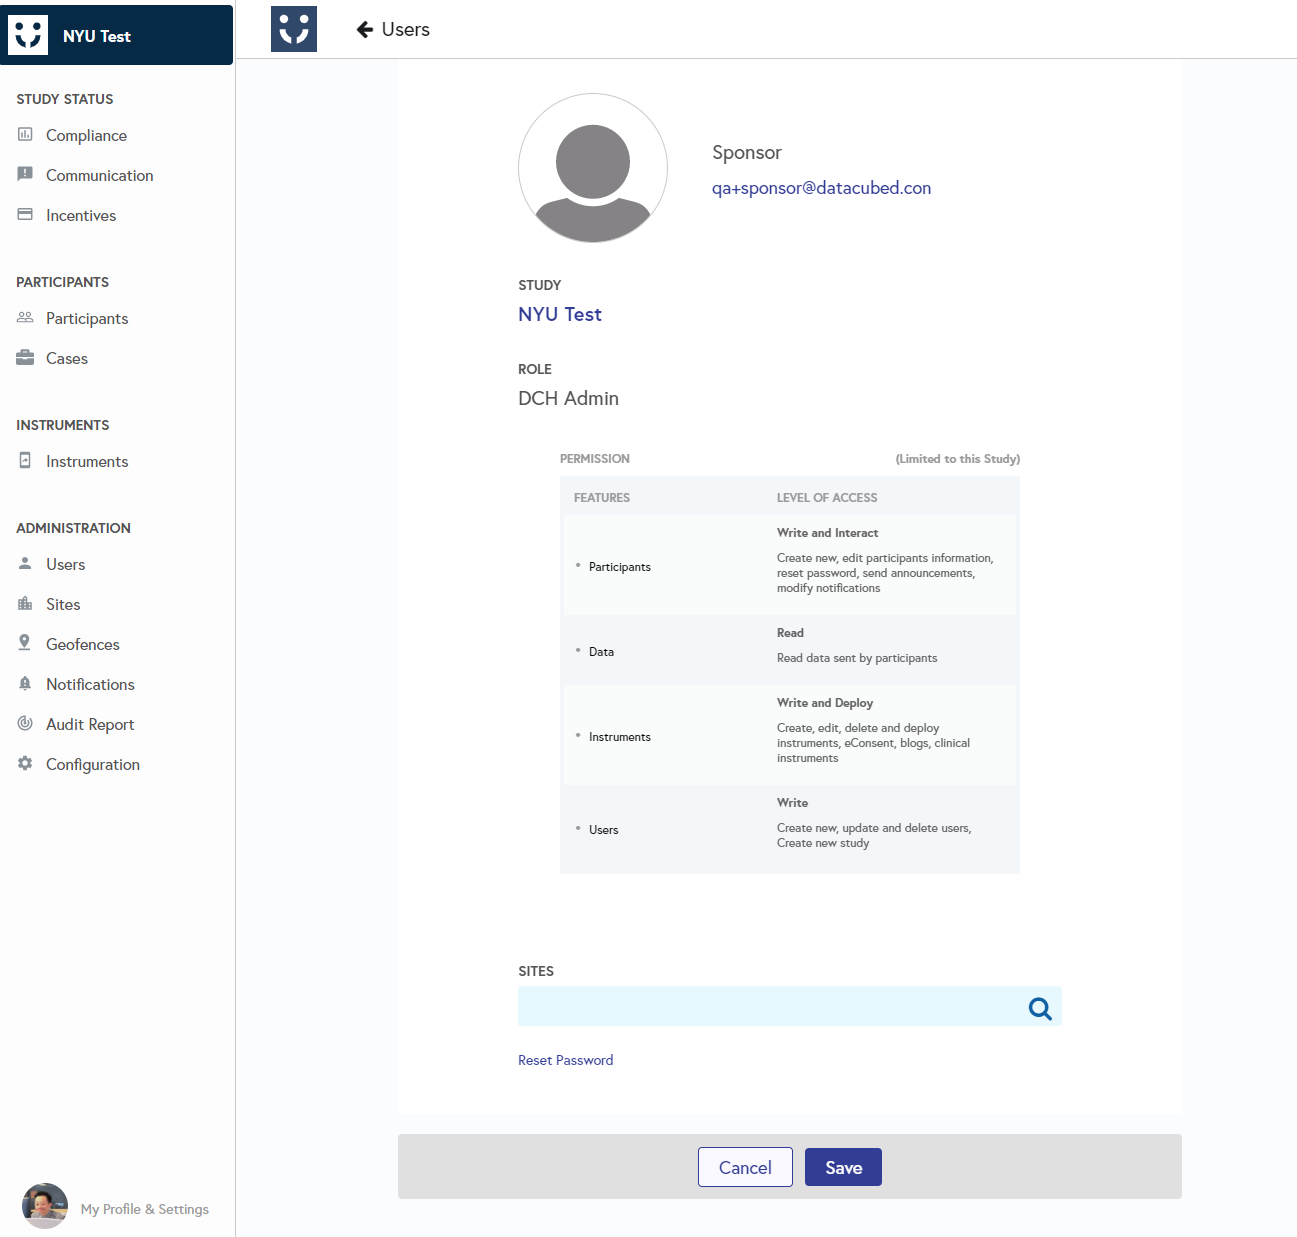
The updated interface showing the new side navigation as well as more detail of the user permissions page which documents to the user the different roles and permission levels.
The case manager view was an example of a specific user type who could see patient specific details, that wouldn’t be available to view by administrators or pharma sponsors.

Outcomes
The Admin Portal has gone through a variety of iterations, with new features being constantly added. The ease of use of the tool has been praised by customers and the process of continous feedback and improvement made it easy to plan a long standing product roadmap of feature improvements.
By the end of 2019, our clinical engine was powering over a dozen studies across a wide range of therapeutic areas.